|
武汉金雀数据科技有限公司 论文导向计量实证社区 联合主办 Back
to Homepage |
|
|
|
|
| ||
|
Illustration of Economic and Financial Prediction and Early Warning System
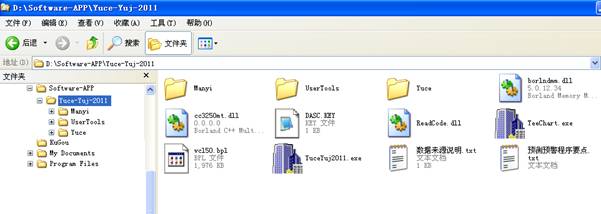
〇、General Operation 1、Unzip Forecasting. rar to hard disk or a folder
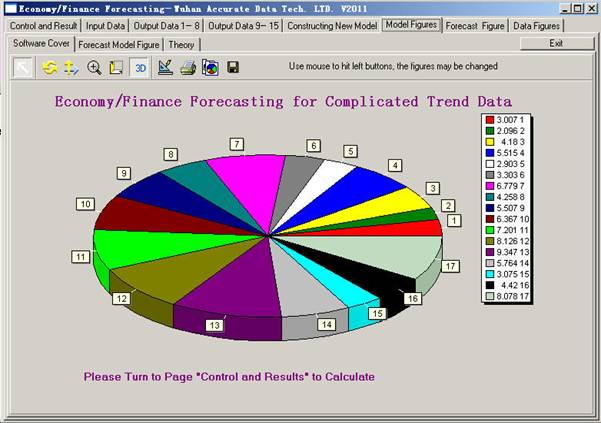
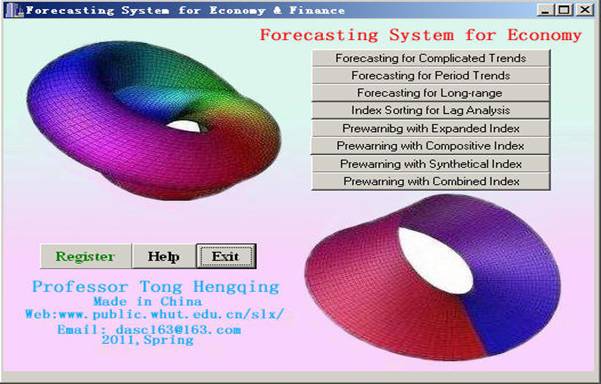
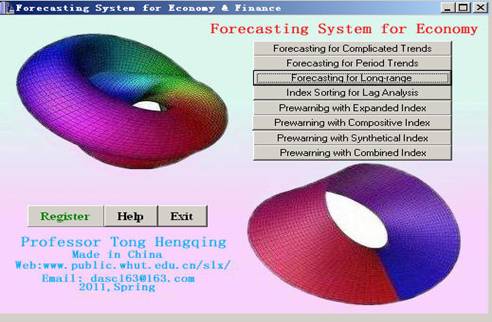
2、Click Forecasting. Exe, shows the main screen
一、Economy/Finance Forecasting for Complicated Trend Data 1、Click the button "Forecasting for Complicated Trend " in the main menu
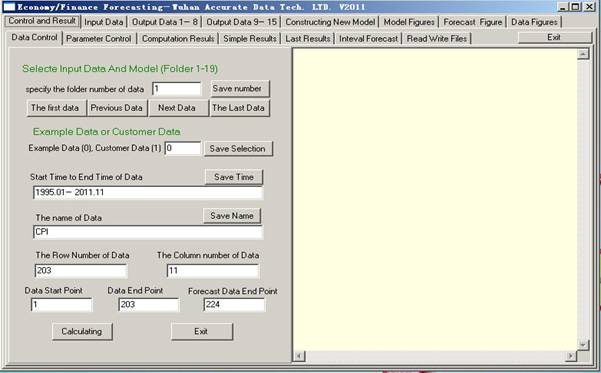
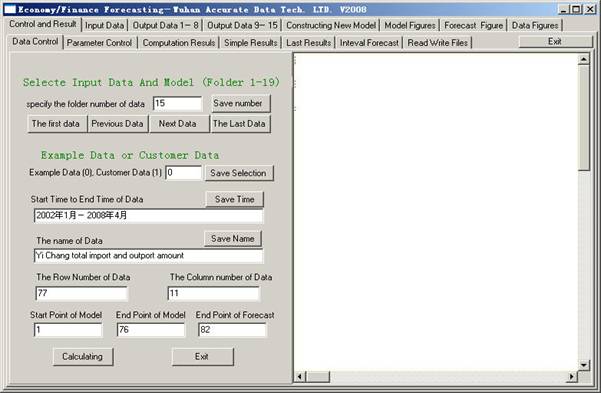
2、Go to the control and the results page for calculation
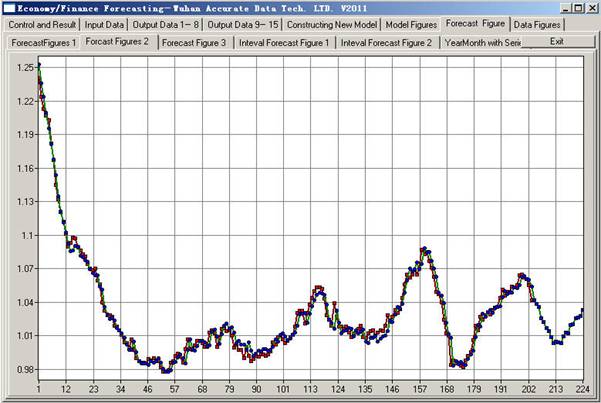
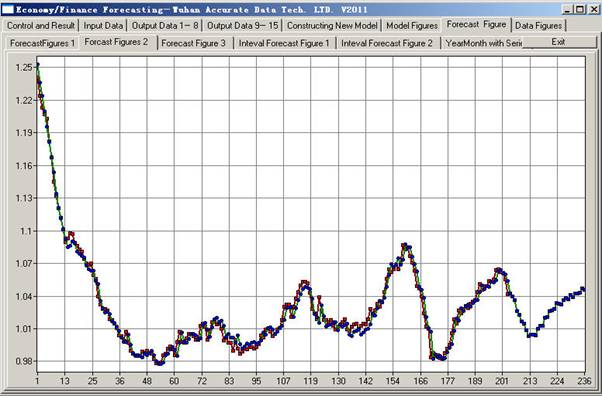
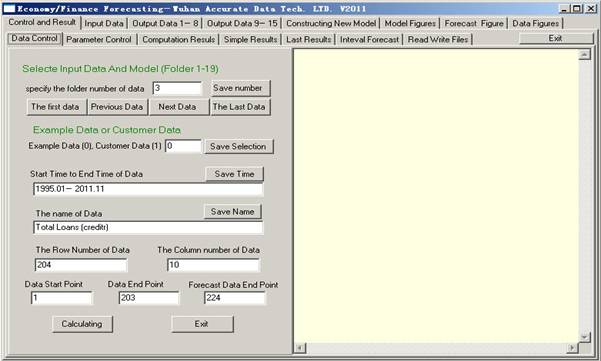
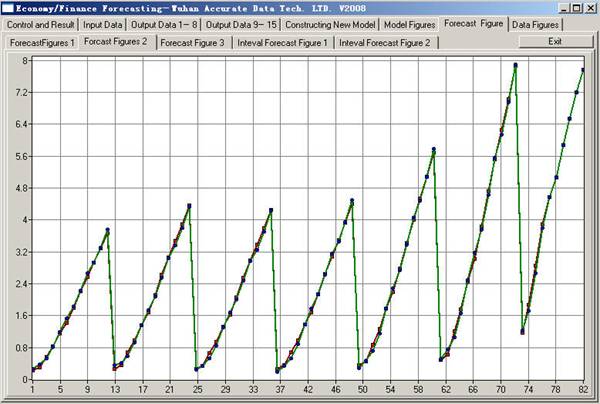
3, confirm "box to specify data folder number is 1, packet name for" CPI forecast data. Otherwise the press of a button the first set of data. 4, adjusting the end frame data for 224, click start button. Wait for a few seconds to complete. 5, click on the button "prediction image", according to predict the image. Note from 1 to 203 for fitting data, the fitting effect is very good. From 204 to 224 as the single line, is the forecast data.
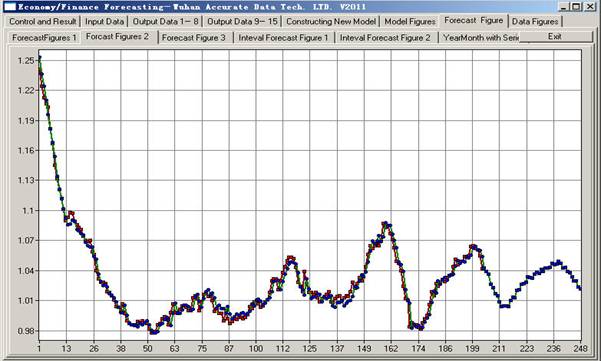
6, back to the control and the results page, modify the terminal box number is 236, and then click the button "start computing", to "predict image" page, see the prediction curve bend.
Back to the control and the results page, modify the terminal box number is 248, and then click the button "start computing", to "predict image" page, see the prediction curve to continue making a turn now.
This model is linear, able to make longer-term prediction, but can do complicated trend prediction. So amazing. The early stage of the fitting is very good, so we believe that its forecast results.
More output can be found on the page, also can be found in the output file. The meaning of the output file, have special documents hint *. TXT. Can also according to the file to identify the name of the Chinese phonetic alphabet, can also according to the generated date.
If the user's own made up large application system, called NoForm01. DLL, NoForm02. DLL, NoForm03. DLL, these files will not display interface, completely is the background computation. Large application system can according to the output data file, to make their own output image form. Our product is completely embedded dynamic link library.
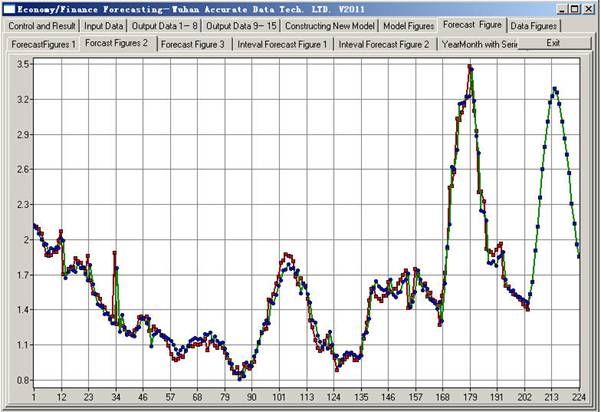
7, continue to return to control and the results page, replace "box to specify data folder number" of three packets name for "the balance of loans of financial institutions (variable than for the same period)", and click start calculate button, and then to "predict image" page, see the balance of loans of financial institutions predict curve. The early stage of the fitting is very good, so we believe that its forecast results.
8、Remember to click "exit" button to exit. If you want to enter the other main menu, you need to restart the home screen
二、The hysteresis cycle data cointegration forecasting 1、Click Forecasting. Exe, restart the home screen
2、Click the button "Forecasting for period trend", in the main menu
3、Go to the control and the results page for calculation
4、Confirm "box to specify data folder number" for the 14, packet name for "yichang social total retail sales of goods". Otherwise, the press of a button on a set of data, the next set of data. Of course, also can adjust, other indicators. 6、Adjusting the end frame data for 92, click on the start button calculation. Wait for a few seconds to complete. 7、Click the button "prediction image", according to predict the image. Note from 1 to 72 for fitting data, the fitting effect is very good. From 73 to 92 as the single line, is the forecast data. Note the epitaxial 16 points, curve bend automatically.
三、Logit model trend prediction 1、Click Forecasting. Exe, restart the home screen
2、Click
the button "Forecasting for long range", in the main menu 3、Go to the control and the results page for calculation
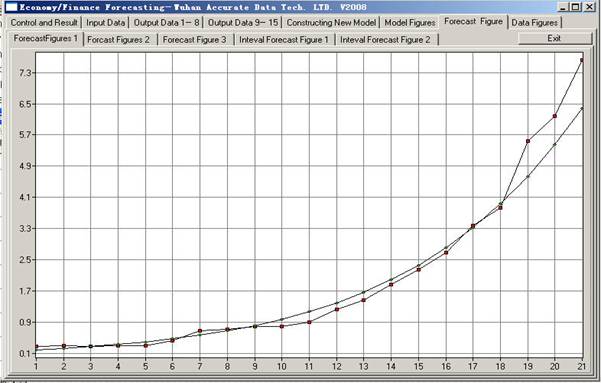
4、Confirm "box to specify data folder number" is 1, packet name for "home sales area in hubei province". Otherwise, the press of a button on a set of data, the next set of data. Of course, also can adjust, other indicators. 6、Confirm or adjust the extensional forecast points box data of 50, click on the start button. Wait for a few seconds to complete. 7、Click the button "prediction image", according to predict the image. Note from 1 to 21 as fitting data, the fitting effect is good.
8、Turn to page "point prediction image 2", from 22 to 71 as the single line, is the forecast data. Note the epitaxial 50 points, curve bend automatically. Has obvious trend in 50 points, thus can make trend prediction.
More output can be found on the page, also can be found in the output file. The meaning of the output file, have special documents hint *. TXT. Can also according to the file to identify the name of the Chinese phonetic alphabet, can also according to the generated date.
If the user's own made up large application system, called NoForm01. DLL, NoForm02. DLL, NoForm03. DLL, these files will not display interface, completely is the background computation. Large application system can according to the output data file, to make their own output image form. Our product is completely embedded dynamic link library.
This system also has the warning function calculation, has registered functions, a theoretical study of references, there are many functions of data input. The user can slowly looking for experience.
|
|
武汉金雀数据科技有限公司 论文导向计量实证社区 联合主办
Tel: 1897 153 1897 E-mail
dasc163@163.com |